Top 8+ Smart AI Data Analytics Tools
Leveraging smart AI data analytics tools is essential for businesses to transform raw information into strategic insights.
With features that streamline complex analyses and the advantage of freemium plans, these tools i have put together provide organisations the opportunity to explore powerful solutions without upfront costs.
Delve into the Top 8+ AI data analytics tools, showcasing their key functionalities and use cases to help you make informed choices for your business.
1. Tableau
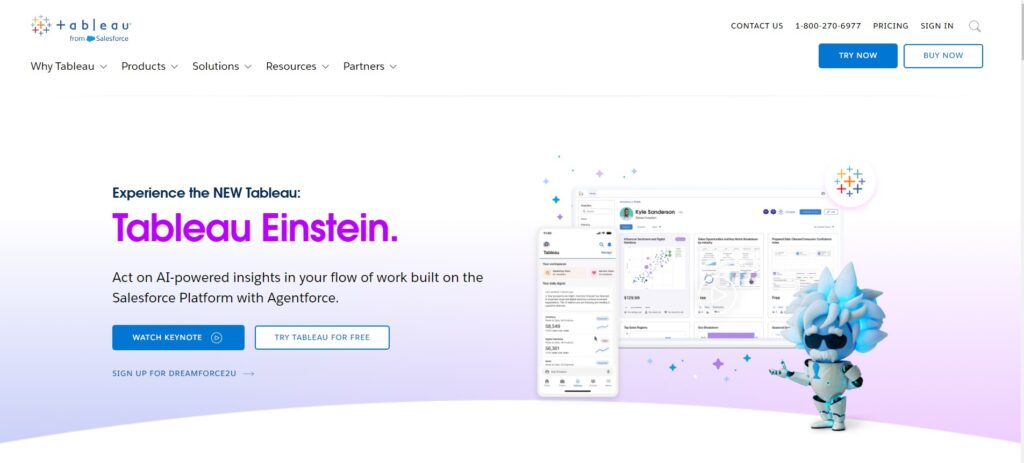
This platform leverages smart AI-driven insights to help users analyse data effectively.
As one of the best data analytics tools available, Tableau is known for providing businesses with the ability to explore data from multiple angles, making it a must-have tool for professionals seeking actionable insights.
Key Features
Tableau provides a host of features that make it ideal for AI-enabled analytics. These include:
- Drag-and-Drop Interface: Tableau allows users to create customisable, interactive dashboards with ease through its user-friendly drag-and-drop functionality.
- Smart AI-Powered Data Insights: With built-in machine learning models, Tableau can automatically identify trends, make predictions, and provide relevant insights.
- Data Connectivity: Tableau connects to various data sources including cloud services like Google Analytics and databases like SQL, allowing for seamless data integration.
- Real-Time Collaboration: Teams can collaborate in real-time on the same dataset, ensuring that decisions are based on the most current data available.
- Interactive Data Visualisations: Tableau excels at transforming raw data into stunning visual representations, enabling users to identify patterns and insights quickly.
For those in the AI-enabled business sector, Tableau offers versatile use cases. It can be utilised for data exploration, performance tracking, and predictive analytics across industries like education, retail, healthcare, and finance. Tableau’s smart analytics also assist in optimising AI-powered marketing strategies.
Use Cases
Whether you’re a marketer needing to track consumer behaviour or an executive wanting to visualise complex financial data, Tableau serves as a go-to platform for a wide array of data-driven tasks. Some use cases include:
- Business Intelligence: Tableau’s AI features assist executives and analysts in predicting market trends and making data-driven decisions.
- Predictive Analytics: The AI models built into Tableau offer predictions based on historical data, helping businesses forecast sales and demand.
- Performance Analysis: The platform can track and measure KPIs, offering visual insights into business performance over time.
- Data Collaboration: Teams across departments can share visual reports in real-time, making Tableau ideal for collaborative environments.
Pricing
The pricing structure of Tableau starts with the Tableau Viewer plan at $35 per user/month, ideal for those who need to interact with dashboards and visualisations. For more robust usage.
To learn more about Tableau’s pricing and features, visit the official Tableau website.
2. KNIME
KNIME supports advanced data analysis, machine learning, and automation processes, making it one of the most sought-after tools for AI-driven data analytics. Learn more about how AI-enabled technologies are shaping the future of business and data analysis.
Key Features
KNIME offers several robust features that make it ideal for various industries and use cases:
- Visual Workflow Editor: Its drag-and-drop interface allows users to create workflows easily, making data analysis more accessible even for non-programmers.
- Machine Learning & Data Mining: KNIME has a rich library of pre-built nodes for predictive analytics, clustering, classification, and deep learning, which streamlines AI model creation.
- Flexible Integration: It seamlessly integrates with Python, R, and Apache Spark, offering users the ability to customise workflows with external tools.
- Automation and Scalability: KNIME supports automation for large-scale data processing and model deployment, making it highly scalable for enterprise-level use.
- Open-Source Flexibility: The platform offers a free open-source version with plenty of flexibility and access to additional functionalities through its marketplace extensions.
Use Cases
KNIME is highly versatile and can be applied across various industries, from banking and finance to telecommunications, healthcare, and education. Here are some of its key use cases:
- Fraud Detection: KNIME enables the identification of fraudulent activities in the financial sector by analysing transaction patterns.
- Customer Segmentation: Used in marketing for customer clustering, helping businesses develop targeted campaigns.
- Predictive Maintenance: In manufacturing, KNIME is applied to predict equipment failure based on historical data.
- Pharmaceutical Research: KNIME supports drug discovery by providing advanced data analytics for simulation and modelling.
Pricing
KNIME offers a starting plan of $99 per month
Visit the official KNIME website
3. Power BI
One of its standout features is the real-time data visualisation, which allows users to create interactive reports and dashboards effortlessly.
Additionally, Power BI seamlessly integrates with various data sources, including Excel, SQL Server, and cloud services, enabling users to gather and analyse data from multiple channels.
Another key feature is the AI capabilities within Power BI, such as natural language queries and machine learning integration, which empower users to ask questions and get insights without needing extensive technical expertise.
Furthermore, Power BI offers collaboration features, allowing teams to share reports and dashboards easily, fostering a data-driven culture across organisations.
Use Cases for Power BI
Power BI is widely used across various industries for diverse purposes. For instance, in the financial sector, it helps analysts track and visualise key performance indicators (KPIs), enhancing financial forecasting and reporting.
In retail, businesses utilise Power BI to monitor sales trends and customer behaviour, enabling them to make informed inventory decisions. Moreover, healthcare providers leverage the tool for patient data analysis and operational efficiency improvements.
Pricing:
Service starts at $10.00 per user per month for the Pro plan, which provides full access to all features.
Visit their official website at powerbi.microsoft.com.
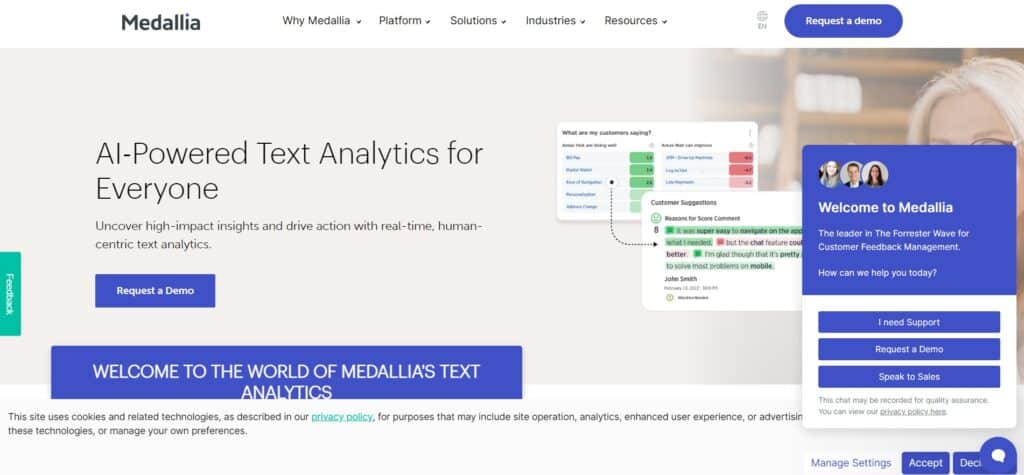
4. MonkeyLearn
MonkeyLearn is an advanced AI-based text analysis tool that enables businesses to extract valuable insights from large volumes of unstructured data.
Leveraging machine learning algorithms, MonkeyLearn can quickly process and classify text data, making it a powerful tool for companies looking to understand customer feedback, social media sentiment, and other text-heavy data sources.
Main Features of MonkeyLearn
- Text Analysis: MonkeyLearn excels at performing sentiment analysis, keyword extraction, and intent classification on unstructured data like emails, reviews, and social media posts.
- Customisable Machine Learning Models: Users can build their own machine learning models without needing any coding skills, tailoring the tool to their specific needs and use cases.
- Data Visualisation: It offers integrations with tools like Tableau, Excel, and Google Data Studio, allowing users to visualise text analytics results and create dashboards.
- API Integration: MonkeyLearn’s API makes it easy to integrate with a wide range of platforms, automating text analysis workflows.
- Pre-Built Models: For quick setup, MonkeyLearn provides pre-trained models for tasks like sentiment analysis, classification, and keyword extraction.
Website Use Cases
MonkeyLearn is ideal for various industries and applications, including:
- Customer Feedback Analysis: Businesses can use MonkeyLearn to analyse customer reviews and surveys, identifying trends and improving customer satisfaction.
- Social Media Monitoring: Brands can leverage MonkeyLearn to monitor and analyse social media sentiment, helping them stay on top of public perception and manage their reputation.
- Support Ticket Classification: MonkeyLearn automates the categorisation of support tickets, enabling customer support teams to resolve issues faster and more efficiently.
- Market Research: It can be used to process large datasets from market surveys, extracting key themes and sentiments.
Pricing and Plans
This website offers tailored pricing plans.
To learn more and get started with MonkeyLearn, visit their official website.
5. RapidMiner
Its versatility and ease of use make it a top choice for both technical and non-technical users.
RapidMiner enables businesses to create detailed models from vast data sets, making data-driven decisions faster and more accurate.
Main Features of RapidMiner
- Data Preparation: RapidMiner streamlines the data prep process, allowing users to clean, integrate, and transform data easily with a drag-and-drop interface.
- Automated Machine Learning (AutoML): RapidMiner automates the process of building and optimising machine learning models, helping users quickly identify patterns and trends in their data.
- Visual Workflows: Users can design complex workflows visually without coding, making it easier to understand and manage large data processes.
- Advanced Algorithms: The platform supports a wide range of machine learning algorithms, allowing users to build predictive models tailored to their needs.
- Integration with Other Tools: RapidMiner integrates with popular data sources and platforms like Python, R, and Tableau, making it a flexible solution for advanced analytics projects.
- Collaboration Features: Teams can collaborate on data science projects directly within RapidMiner, sharing insights and models in real-time.
Website Use Cases
RapidMiner caters to a variety of industries and use cases, including:
- Predictive Maintenance: Manufacturing industries can use RapidMiner to predict when machinery is likely to fail, thus reducing downtime and improving efficiency.
- Customer Churn Prediction: RapidMiner helps businesses in retail and telecommunications predict and prevent customer churn by analysing behavioural data and identifying risk factors.
- Financial Forecasting: Financial institutions can use the platform to forecast revenue, analyse risks, and optimise investments, leveraging AI for better decision-making.
- Healthcare Analytics: RapidMiner assists healthcare providers in analysing patient data to predict outcomes and improve patient care, ensuring better resource allocation.
Pricing and Plans
RapidMiner offers a freemium plan, which includes access to its platform for up to 10,000 rows of data, making it ideal for small projects or experimentation.
For larger data sets and advanced features, paid plans start at $2500 per user per year, offering scalability and enterprise-level solutions.
To explore RapidMiner and its full capabilities, visit the official website.
6. Qlik
It enables users to transform raw data into meaningful insights with an intuitive interface, combining powerful AI capabilities with advanced analytics to deliver real-time data-driven results.
Main Features of Qlik
- Associative Engine: Qlik’s unique associative model allows users to explore data in any direction, enabling deeper insights without restrictions from traditional query-based tools.
- AI-Powered Insights: With AI integration, Qlik Insight Advisor automatically generates insights, suggestions, and visualisations based on data patterns, helping users uncover hidden trends.
- Interactive Dashboards: Qlik offers a flexible, interactive dashboard that allows users to dive into complex data sets with drag-and-drop simplicity, making it ideal for exploring multi-dimensional data.
- Augmented Analytics: Qlik’s augmented analytics provide recommendations on visualisations and data exploration paths, giving businesses an edge in making more informed decisions.
- Collaborative Features: Users can collaborate across teams, sharing data insights and analyses to drive company-wide decisions.
- Integration Capabilities: Qlik integrates seamlessly with various data sources, enabling businesses to collect and analyse data from numerous platforms, including cloud services, databases, and enterprise systems.
Website Use Cases
Qlik serves various industries with powerful use cases, such as:
- Retail Sales Analysis: Retailers can track real-time sales performance, inventory levels, and customer behaviour to optimise their operations and increase revenue.
- Financial Services: Financial institutions use Qlik to analyse risk, monitor compliance, and forecast financial outcomes, making data-backed strategic decisions.
- Healthcare Data Analytics: Hospitals and healthcare providers leverage Qlik to analyse patient data, optimise care delivery, and improve patient outcomes by tracking performance metrics.
- Supply Chain Optimisation: Qlik provides visibility across the supply chain, helping businesses monitor logistics, inventory, and supplier performance for streamlined operations. Read more about AI’s role in business logistics in the AI for Business Applications
Pricing and Plans
This website offers tailored pricing. Contact the sales team
To discover more about Qlik and its advanced AI analytics capabilities, visit the Qlik official website.
7. Polymer
Polymer is an AI-powered data analytics tool designed for both technical and non-technical users, offering a simple yet powerful way to analyse and visualise data without the need for coding skills.
Its intuitive drag-and-drop interface allows users to transform data from spreadsheets and other sources into interactive dashboards and reports, making it ideal for businesses looking to democratise data analytics.
Main Features of Polymer
- No-Code Data Visualisation: Polymer’s standout feature is its no-code platform, allowing users to build sophisticated data visualisations without writing a single line of code.
- AI-Powered Recommendations: The platform’s AI algorithms automatically generate insights and suggest the best ways to visualise data based on patterns, helping users quickly find actionable insights.
- Customisable Dashboards: Users can create custom dashboards to track key performance indicators (KPIs) in real-time, enhancing decision-making across teams.
- Data Import Flexibility: Polymer supports seamless integration with various data sources, including Google Sheets, Excel, and SQL databases, allowing users to pull data from multiple platforms for unified analysis.
- Collaboration Tools: The platform provides collaborative features, enabling teams to share insights and visualisations, driving informed decision-making across departments.
- Real-Time Data Analytics: Polymer ensures businesses stay agile by providing real-time analytics, helping users respond quickly to emerging trends and opportunities.
Website Use Cases
Polymer is suitable for a wide range of industries and use cases, including:
- Marketing Campaign Analytics: Marketers can use Polymer to track campaign performance, customer engagement, and conversion rates, optimising marketing strategies for better results.
- Sales Tracking: Sales teams can leverage Polymer to monitor pipeline activity, identify high-potential deals, and generate reports on sales performance.
- Product Performance Monitoring: Companies can analyse product performance, customer feedback, and sales trends, allowing product managers to make data-driven decisions for product improvements.
- Financial Analysis: Financial analysts use Polymer to generate comprehensive financial reports, track budgets, and forecast revenues, streamlining financial planning and analysis.
- Education Analytics: Educators and academic institutions can track student performance, analyse enrolment trends, and make data-driven decisions to improve educational outcomes.
Pricing and Plans
For businesses requiring advanced functionality, the paid plans start at $5 per user per month.
To learn more about Polymer and its capabilities, visit the Polymer website.
8. Sisense
This robust platform merges data from multiple sources and turns it into actionable intelligence through intuitive dashboards and AI-driven analytics.
Key Features of Sisense:
- End-to-End Data Integration: Sisense consolidates data from numerous sources such as SQL, Google Analytics, and Excel, providing a single unified platform for analysis.
AI-Powered Insights
With advanced AI features, Sisense delivers predictive analytics, helping users forecast trends and make data-driven decisions.
- Customisable Dashboards: The platform enables users to create tailored dashboards and interactive visualisations, making it simple to track KPIs and business metrics in real-time.
- Natural Language Query (NLQ): Sisense allows users to ask questions using natural language, making data analysis more accessible for non-technical users.
- Embedded Analytics: Sisense’s analytics can be embedded into websites, apps, and products, enabling businesses to offer their users seamless access to analytics.
- Scalability: Designed for both small businesses and enterprises, Sisense’s scalable architecture handles datasets of all sizes effortlessly.
Sisense Use Cases:
- Retail: Retailers can use Sisense to analyse customer behaviour, optimise inventory, and track sales performance.
- Healthcare: Healthcare providers use Sisense to analyse patient data, improve service delivery, and track healthcare outcomes.
- Financial Services: Financial analysts benefit from Sisense by generating detailed financial reports, forecasting revenue, and managing budgets.
- Manufacturing: In manufacturing, Sisense helps optimise production processes by analysing operational data and improving equipment performance.
- Education: Educational institutions use Sisense for analysing student performance and identifying trends in attendance and grades.
Pricing & Plans
Sisense offers custom pricing, typically starting around $83 per user/month.
The final price varies depending on the size and needs of your business. While there is no free or freemium plan, new users can take advantage of a free trial to explore its capabilities before committing.
Visit Sisense’s official website to learn more about their pricing structure.
9. IBM Watson Analytics
With AI-powered automation, IBM Watson helps businesses uncover actionable insights, generate visualisations, and simplify data exploration.
Key Features of IBM Watson Analytics:
- Automated Data Preparation: IBM Watson automatically prepares and cleans your data for analysis, allowing you to focus on interpreting the results rather than handling manual tasks.
- Natural Language Query: Users can interact with data through natural language processing, making it easier to ask questions and get insightful answers without needing to be a data expert.
- Predictive Analytics: IBM Watson utilises machine learning algorithms to offer predictive insights, helping businesses forecast trends and make informed decisions.
- Data Visualisation: With powerful visualisation tools, Watson allows users to create dashboards that present complex data in easy-to-understand formats.
- Scalability: The platform is designed for organisations of all sizes, from small businesses to large enterprises, making it a versatile solution for various data needs.
Use Cases for IBM Watson Analytics:
- Healthcare: Healthcare providers leverage Watson to analyse patient data, track healthcare outcomes, and improve operational efficiency.
- Finance: Financial institutions use IBM Watson to manage risk, forecast revenue, and automate financial reporting.
- Retail: Retailers can optimise supply chain management and improve customer experience using Watson’s AI capabilities.
- Education: Educational institutions use Watson to analyse student performance and develop tailored learning programs.
Pricing & Plans:
IBM Watson offers flexible pricing depending on the needs of your organisation. The service typically starts at $30 per user/month, and a free tier is available for businesses or individuals who want to explore basic features before upgrading.
For more information on pricing and capabilities, visit their official website.
10. Google Cloud Smart Analytics
Google Cloud Smart Analytics is an advanced AI-powered data analytics tool offering comprehensive solutions for businesses looking to leverage big data effectively. As one of the most reliable and scalable platforms available today, it allows organisations to analyse, store, and gain actionable insights from their data through machine learning and AI capabilities. Google Cloud Smart Analytics is an ideal option for those who want to integrate AI analytics into their business without having to manage complex infrastructure.
Main Features
Google Cloud Smart Analytics provides a suite of features designed for scalability and ease of use. Its key features include:
- BigQuery: A fully-managed data warehouse allowing for fast SQL queries.
- Looker: A business intelligence platform that provides dashboards and data visualisations.
- Vertex AI: Enables businesses to build and scale AI models with ease.
- Dataflow: Offers real-time data processing for continuous analysis.
- Dataproc: Simplifies Spark and Hadoop workloads for efficient data management.
These features make Google Cloud Smart Analytics one of the most robust platforms available for businesses needing smart AI analytics tools.
Use Cases
Google Cloud Smart Analytics is designed to cater to various industry-specific use cases:
- Retail: Enhancing customer experience through real-time personalisation and inventory management.
- Financial Services: Detecting fraud and enhancing risk management.
- Healthcare: Accelerating medical research and providing predictive analytics for patient outcomes.
- Manufacturing: Optimising supply chains and improving product quality through data insights.
Pricing and Freemium Plan
The pricing for Google Cloud Smart Analytics is flexible, based on usage:
- BigQuery: Starts at $0.02 per GB stored and $5 per TB of data processed.
The platform offers a free tier for certain products like BigQuery and Vertex AI, making it accessible for businesses to explore its capabilities before committing to full-scale implementation.
To explore Google Cloud Smart Analytics, visit the official Google Cloud website.
Adopting smart AI data analytics tools is crucial for organisations aiming to thrive in today’s competitive landscape.
The diverse functionalities of the top 8+ tools not only facilitate data-driven decision-making but also provide cost-effective options through freemium plans.
By harnessing these innovative solutions, businesses can unlock the full potential of their data and propel their growth in an ever-evolving market.